Using the Performance Manager#
This guide explains the different sections of the Performance Manager.
Introduction#
The Performance Manager shows all the scheduled and manual tasks that were performed in your current workspace within the last 24 hours with useful extra information, such as alerts and recommendations. Use the Performance Manager to identify opportunities to optimize configurations or schedules.
To access the Performance Manager, follow these steps:
Go to the Activity page.
Under the page heading, click Performance.
The Performance Manager displays information in three categories:
Recommendations and alerts - messages regarding datastream performance issues
Performance outliers - datastreams that took longer than expected to complete a task
Task durations - the time it took for a task to complete
The Performance Manager page only displays information for the datastreams within your chosen workspace.
Recommendations and alerts#
Recommendations and alerts are displayed at the top of the Performance Manager. This section displays recommendations that will help you avoid datastream performance issues.
An example alert could be: 2 datastreams are blocking your Instances performance. Learn More.
This alert means that two datastreams in your workspace are consuming a lot of resources. As a result, other tasks are blocked due to a lack of resources. To find out which datastreams are consuming the resources, click Learn more. This opens a Performance Manager details overlay that lists the datastreams consuming the resources.
Note
We recommend scheduling tasks evenly throughout the night. Adverity automatically attempts to evenly distribute scheduling times between 00:00 and 06:00.
Performance outliers#
The performance outliers section lists datastreams with tasks that took longer than expected to complete. The table of outliers lists the following information:
- Datastream name
The name of the datastream with the outlier task.
- Increase
The percentage increase in task duration compared to the benchmark completion time.
- Performance
The time the outlier task took to complete, displayed in HH:MM:SS format.
- Benchmark
The expected time it would take to complete the task. The Performance and Benchmark values are used to calculate the increase. For example, if a task has a benchmark completion time of an hour but instead takes two hours to complete, the calculated increase is 100%. The benchmark time is calculated using a rolling average of completion times for previously completed tasks.
- Description
The description tells you which part of the task process caused the outlier to occur. Below are typical examples of outlier descriptions.
Fetch time increased by 00h:06m:26s
Total duration 00h:14m:52s more than usual
14 more API Retries (this indicates an error in the datastream)
The Performance Manager displays information about performance outliers that occurred in the last seven days. By default, only the most recent outliers are displayed in the table, and only one outlier is shown per datastream. To view all the performance outliers that have occurred in the last seven days, click See [3] More (the number of additional outliers to view).
Solving outlier issues#
Below is a list of solutions for tasks that are taking too long:
To reduce the Fetch phase, fetch smaller amount of data.
To reduce the Transform phase, reduce the complexity of the assigned transformations.
To reduce the Load phase, review the configuration of your assigned destinations.
Long idle or waiting times between phases may be caused by too many tasks scheduled to take place at the same time.
Task durations#
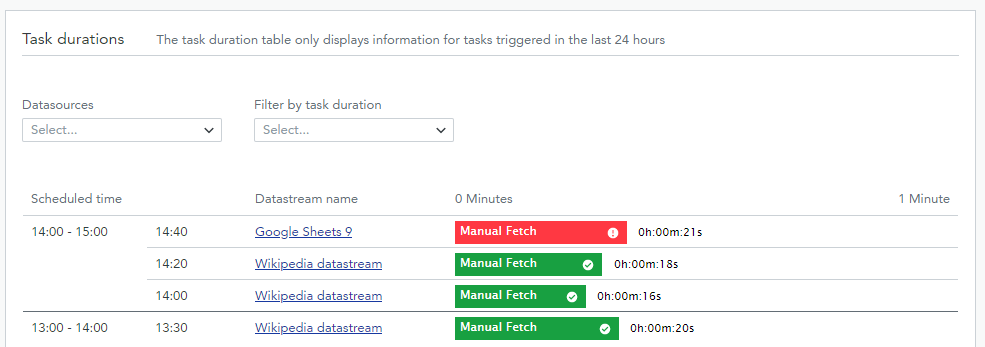
Task durations are displayed in a table that shows tasks from every datastream within your Adverity workspace. The most recently completed task is displayed at the top. Manual fetch is shown next to the task duration for manual fetches.
The table lists the following information:
The hourly time window and ten-minute time window in which the task was performed
The name of the datastream with which the task is associated
How long the task took to complete, in HH:MM:SS format and as a task duration bar
You can use the Datasources and Filter by task duration drop-down menus to view tasks associated with datastreams that fetch data from a specific data source, or tasks that took a specific length of time to complete.

The Task durations table within the Performance Manager
Understanding the task duration bar#
The task duration is displayed as a colored bar, where each color represents a different task status. A task duration bar may contain more than one color. For example, a task duration bar may contain a brown section and then a cyan section, indicating the task was delayed before successfully completing.
Before you hover over a bar, you will see the following colors:
Green indicates a task was completed successfully.
Red indicates there was an error while processing the task.
Hover your mouse over a bar to see a more detailed breakdown of task statuses:
Blue indicates a task was completed successfully.
Red indicates there was an error while processing the task.
Yellow indicates a task has been canceled.
Brown indicates a start delay for the scheduled task.
Gray indicates a task is still in progress.
When you hover over a task duration bar, you will also see a tool tip. These tool tips display the following information:
How long the task took to process.
How long the task was pending.
The data source from which data was fetched.
The number of transformations applied.
The number of destinations into which the data is being loaded.
The cause of a task being idle.