Working with universal monitors#
This guide explains how to use universal monitors.
Introduction#
- What are monitors and what can they do?
A data monitor is an automated data quality check that is performed each time you fetch data. With data monitors, you can find anomalies in your data more easily.
For an overview of your data monitors, see Introduction to the Data Quality page.
- What types of monitors are there in Adverity?
There are two types of data monitors in Adverity:
Universal monitors
Universal monitors detect data anomalies and flag potential issues across all data sources. They perform general data quality checks, such as finding duplicate rows in your data.
By default, universal monitors raise a warning when an anomaly is detected. You can edit some of the universal monitors to trigger an error for specific datastreams.
The duplication and volume monitors raise warnings by default when anomalies are detected. You can customize these settings for specific datastreams as needed.
Custom monitors
Custom monitors allow you to define custom rules that your data must meet.
For more information, see Working with custom monitors.
- How do I use universal monitors?
You can manage universal monitors in the following ways:
Globally - Enable or disable universal monitors for all datastreams in the Administration page of the root workspace.
In bulk - Configure settings for multiple datastreams at once from the Data Quality page.
Individually - Customize settings for a specific datastream, which will override the global configuration.
This flexibility allows you to apply monitors selectively across your data pipeline. For example, you might enable volume monitoring globally but disable it for a datastream where data volume naturally fluctuates.
Universal monitor types#
Duplication monitor#
The duplication monitor detects duplicate data in the monitored datastreams and alerts you so that you can remove it before any problems occur.
If Adverity detects one or more rows containing identical data in a data extract that you have collected, a Data Quality issue will appear in the Transform & Monitor section of the task in the datastream overview.
By default, the duplication monitor raises a warning. This setting can be changed for individual datastreams.
To check the specifics of detected duplicates, see Viewing details of the Data Quality issues. If necessary, remove the duplicate data from your data extract before loading the data into Data Warehouse or external destinations.
Volume monitor#
The volume monitor detects unexpected changes in the data volume collected by the monitored datastreams. This monitor tracks the total row count of each fetch (both scheduled and manual) and notifies you of any statistical outliers compared to the previous fetches of this datastream. For each monitored datastream, Adverity creates a model based on the moving average of the row count of the latest fetches. If a new value is significantly different from the trend, the monitor triggers an issue. To detect the outliers, Adverity needs at least 10 fetches coming from the monitored datastream.
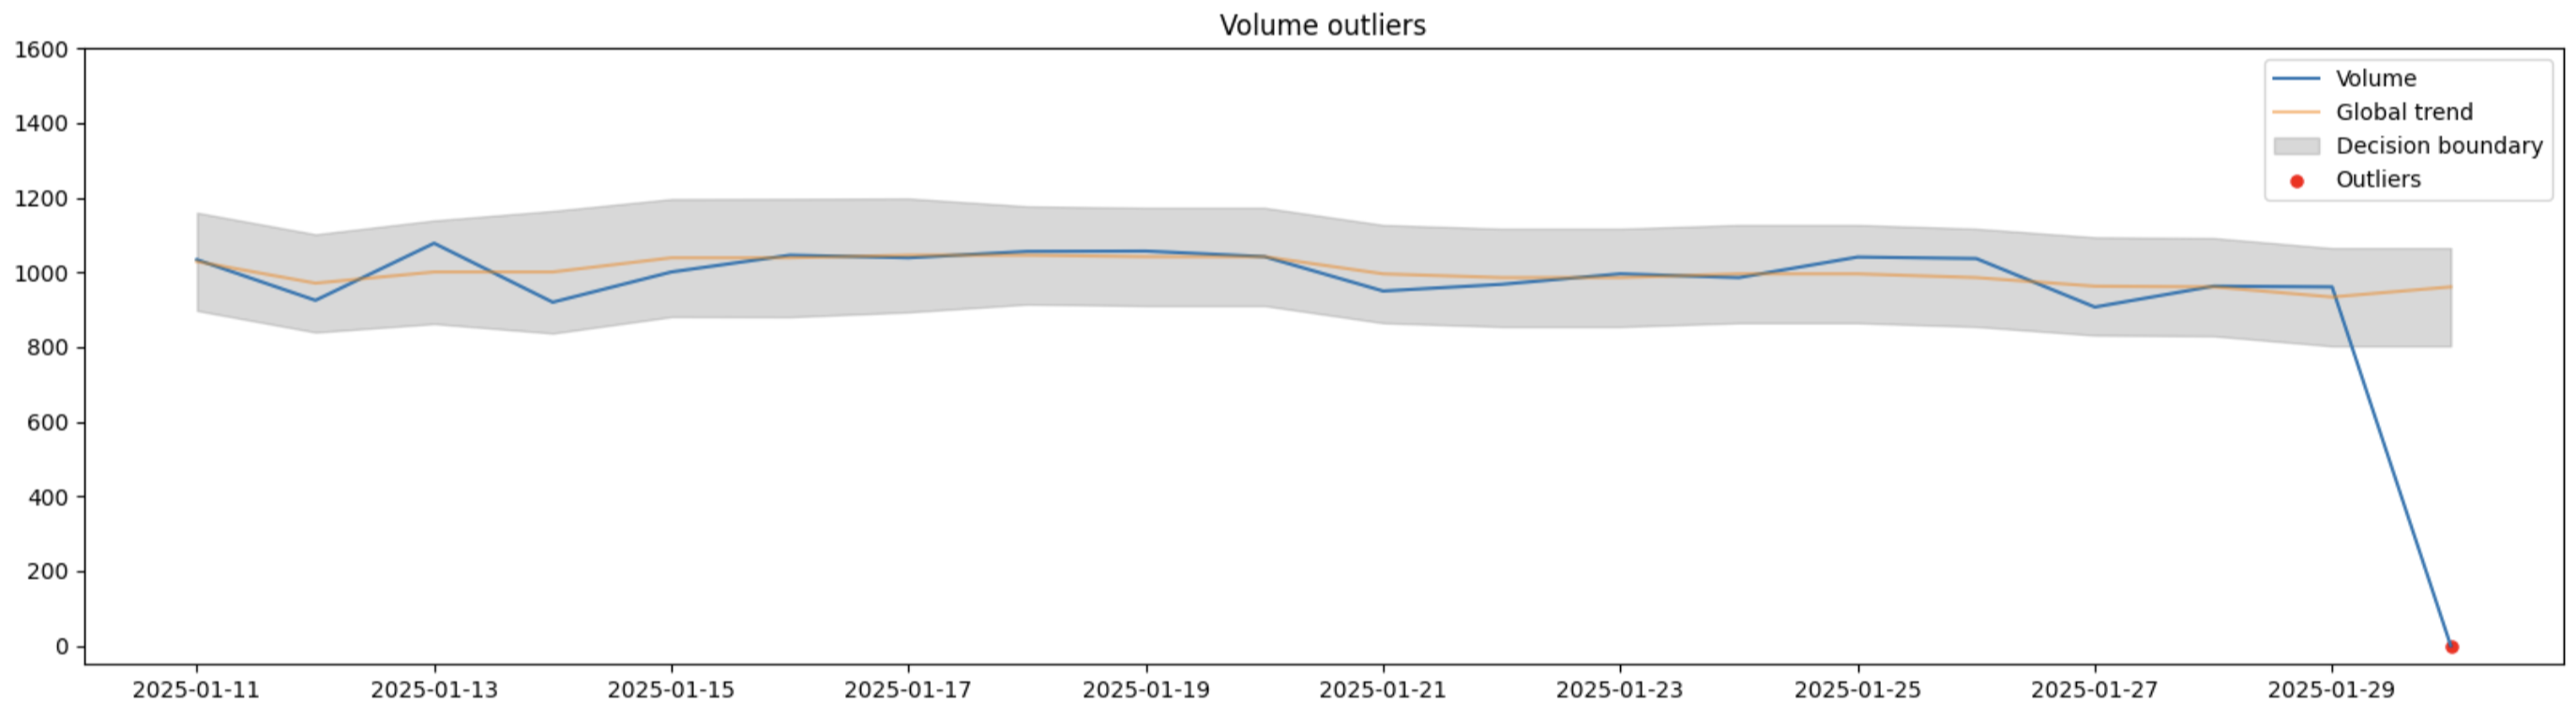
The volume monitor dynamically calculates bounds of acceptable row counts based on previous data. It uses rolling median to define the trend, rolling standard deviation to account for normal volume fluctuations and the sensitivity parameter (σ=2.6) to detect the outliers. In other words, if the difference between the row count of the latest fetch and the current median is bigger than the current standard deviation times 2.6, then the monitor will trigger an issue. The detection process dynamically adapts to the changes in data collection over time, ensuring robust and reliable identification of unexpected deviations in data volume. This helps maintain data quality and quickly detect potential issues in your data flow. The image below shows an example of a significant drop in data volume that will be detected as an outlier and raise an issue.
The volume monitor compares only data extracts with the same date range. For example, if your datastream has two schedules: one is daily and another one is weekly, the volume monitor will group data extracts with the same date range and detect volume outliers for each date range group separately.
Sometimes data volume can change because of new campaign launches, authorization changes or updated configuration settings. However, if your data pipeline is stable and you are not expecting any changes, the volume monitor will help you detect the data volume issues as soon as they appear.
If Adverity detects a change in the row count of the latest fetch, a Data Quality issue will appear in the Transform & Monitor section of the task in the datastream overview.
By default, the volume monitor raises a warning. This setting can be changed for individual datastreams.
To check the specifics of detected volume issues, see Viewing details of the Data Quality issues.
Timeliness monitor#
The timeliness monitor detects the delays in data loading for the scheduled datastreams with at least daily frequency. With this monitor, you can be sure that you are using the latest data. The expected due time is defined in UTC.
This monitor is disabled by default. To start using it, enable the monitor and configure its default settings.
If Adverity detects a delay in data loading, a Data Quality warning will appear in the Transform & Monitor section of the task in the datastream overview.
To check the specifics of detected timeliness issues, see Viewing details of the Data Quality issues.
Column consistency monitor#
The column consistency monitor detects changes in the structure of the data extracts, such as the number of columns, their names and order. The column order monitoring is disabled by default but can be enabled for the datastreams where it matters. The monitor can also optionally resolve uncovered inconsistencies to ensure an uninterrupted flow of data when the issue severity is set to warning. With this monitor, you can be sure that the data extract structure inconsistencies will be detected before they cause issues downstream.
It is especially important to maintain the consistent columns structure for the following data use cases:
Marketing Mix Modeling
Business Intelligence tools, such as Power BI and Tableau
Data warehouses with schema requirements
AI/ML models
Automated downstream data processing relying on a specific input format
The column consistency monitor uses a baseline data extract structure and validates data from all following fetches against it. Initially, when this monitor is enabled for a datastream, the baseline can be set either manually or automatically taken from the structure of the data extract from the latest successful scheduled task. Sometimes the column structure changes can be expected, for example after changing the datastream configuration. If a consistency issue is detected in this case, update a baseline for all future fetches. For more information, see Updating the baseline of the column consistency monitor.
Note
The column consistency monitor is automatically skipped for empty data extracts (extracts with no data rows). This prevents false warnings when a fetch returns no data, as empty extracts may not contain the expected column structure.
If Adverity detects an inconsistency in the data extract’s structure, a Data Quality warning will appear in the Transform & Monitor section of the task in the datastream overview.
To check the specifics of detected column consistency issues, see Viewing details of the Data Quality issues.
Managing universal monitors globally#
Note
This setting is available to users with Administrator permissions in the root workspace of your organization, and will be applied to all child workspaces of the root workspace.
Enabling universal monitors globally#
To switch a universal monitor on or off for all datastreams, follow these steps:
Select the root workspace and then, in the platform navigation menu, click Administration.
In the Data Quality Monitors section of the workspace settings, select or deselect the checkbox for the monitor that you want to enable or disable:
Duplication Monitor
Volume Monitor
Column Consistency Monitor
Timeliness Monitor
You can later disable or edit a universal monitor for a specific datastream.
Configuring the timeliness monitor#
To set the due time by which you expect your data to be loaded, follow these steps:
Select the root workspace and then, in the platform navigation menu, click Administration.
In the Data Quality Monitors section of the workspace settings, enable the timeliness monitor.
In Due time (UTC), select the time in UTC until which you expect your data to be loaded.
(Optional) In Time offset, select the offset in days for the due time. This setting is useful to account for time zone differences between UTC and your local time zone, or when loading large amounts of data.
For example, for a fetch starting on Monday, an offset of 0 days will mean that the data should be loaded by the due time in UTC on Monday, but an offset of 1 day will mean that the data should be loaded by the due time in UTC on Tuesday.
Configuring default monitor status for new datastreams#
In the Administration settings of a workspace, you can define whether universal monitors are enabled or disabled by default for all newly created datastreams in that workspace. This setting ensures that new datastreams automatically adhere to your monitoring strategy without manual configuration.
To configure the default monitor status for new datastreams, follow these steps:
Select the workspace for which to configure the settings and then, in the platform navigation menu, click Administration.
In the Data Quality Monitors section, find the Enable/disable warnings from monitors for all newly created datastreams in workspaces setting.
Select the universal monitor types (e.g., Duplication, Volume) for which you want to enable warnings by default on new datastreams.
As a result, when a new datastream is created in this workspace, the selected monitors will be enabled by default.
Managing universal monitors in bulk#
You can configure universal monitor settings for multiple datastreams at once. This allows you to efficiently apply consistent monitoring rules across different datastreams within a workspace.
To manage universal monitor settings in bulk, follow these steps:
Navigate to the page from which you want to manage the monitor settings. Choose one of the following:
To manage from the Data Quality page, navigate to the Data Quality page and find the universal monitor you want to configure. Click
 Manage monitor in the top right corner of the monitor’s card.
To manage from the Datastreams page, navigate to the Datastreams page, select the checkboxes for the datastreams you want to configure, and click Manage Monitors.
(Optional) Use the filters to find the datastreams you want to configure. You can filter by data source, destination, or workspace.
Select the checkboxes next to the datastreams for which you want to define settings.
Click Define settings.
In the dialog, configure the settings for the selected monitor. For example, for the column consistency monitor, you can set the following:
Enable or disable the monitor.
Choose to trigger an error or a warning if an issue is detected.
Select the Automatically restore the baseline structure checkbox to resolve detected issues automatically.
For more details on the available settings for all universal monitor types, see Editing a universal monitor.
Click Set for selection.
As a result, the selected universal monitor settings are applied to all chosen datastreams.
Customizing universal monitors for specific datastreams#
Each datastream can have its own monitor configuration that overrides the organization-level settings. This allows you to adapt monitoring to the specific characteristics and requirements of different data sources.
Understanding monitor overrides#
Each datastream can have its own monitor configuration that overrides the global settings defined at the workspace or organization level. This provides granular control over how monitors behave for different data sources.
The override logic works as follows:
Enabling a disabled monitor - If a monitor is disabled globally but you enable it for a specific datastream, it will only be active for that datastream.
Disabling an enabled monitor - If a monitor is enabled globally but you disable it for a specific datastream, it will not run for that datastream.
Changing issue severity - You can change a monitor’s issue severity for a specific datastream. For example, you can configure the duplication monitor to trigger an error for one datastream while it only triggers a warning for all others.
This override system allows you to create flexible monitoring strategies tailored to your data quality needs. You can see an overview of all custom monitor settings on the Data Quality page.
Editing a universal monitor#
To change the default universal monitor settings, follow these steps:
Go to the Datastreams page.
Select the datastream you want to configure.
In the Monitor subsection of the datastream overview, find the universal monitors box.
Click
 Edit universal monitors.
For the duplication, volume, and column consistency monitors, select the issue type that should be triggered if the monitor detects an issue from the following options:
- Trigger an error
Select this option to raise an error and stop processing the data.
- Trigger a warning
Select this option to raise a warning and continue processing the data.
For the column consistency monitor, you can additionally perform the following actions:
Select the Include column order in check checkbox to monitor the column order. This setting is disabled by default.
Select the Automatically restore the baseline columns checkbox to resolve the detected issues before loading data into the destination. This checkbox is available only for the Warning severity.
Click Update baseline manually to manually set or update the baseline structure for the current datastream.
For the timeliness monitor, configure the Due time (UTC) and Time offset specific to the datastream.
Click Apply.
Deactivating a universal monitor#
To deactivate a universal monitor for a datastream, follow these steps:
Go to the Datastreams page.
In the Monitor subsection of the datastream overview, find the universal monitors box.
Click
Edit universal monitors.Disable the toggle next to the monitor you want to disable.
Including the monitor’s status in the data extract#
To include the status of the monitor assigned to the datastream in the data extract, update the datastream settings. Only the status of the monitors with severity set to Warning can be included. For more information, see Configuring advanced datastream settings.
Updating the baseline of the column consistency monitor#
Sometimes the column structure changes can be expected, for example after changing the datastream configuration.
Setting the baseline manually#
Setting the baseline manually is useful for the datastreams that do not use schedules because the automatic baseline is detected only from a scheduled fetch.
You can set the baseline manually to up to 500 columns.
To set the baseline manually, follow these steps:
Go to the Datastreams page.
Select the datastream you want to configure.
In the Monitor subsection of the datastream overview, find the universal monitors box.
Click
Edit universal monitors.Click Update baseline manually.
Enter the column names for the baseline. The names are case-sensitive.
Click Update baseline.
As a result, the monitor will use these columns as a baseline.
Updating the baseline based on the latest scheduled fetch#
If you want to use the structure of a data extract as the baseline, follow these steps:
Go to the Datastreams page.
Select the datastream you want to configure.
Run a fetch to collect a data extract with the new structure.
Open the column consistency issue details for this fetch.
Review the changes of the data extract structure.
Select the Use this column structure as a new baseline checkbox.
As a result, the baseline has been updated to the structure of the latest data extract and all following fetches will be validated against it.