Introduction to the Data Quality page#
The Data Quality page is where you can see an overview of your data monitors.
A data monitor is an automated data quality check that is performed each time you fetch data. With data monitors, you can find anomalies in your data more easily.
For more information about data monitors, see Working with universal monitors and Working with custom monitors.
You can set up notifications for the Data Quality issues. You can choose to receive individual notifications for each issue as it occurs, or set up a regular digest that summarizes all unacknowledged issues on a daily or weekly basis. For more information, see Managing user notifications and Regular DQ Digest.
Data Quality health#
The Data Quality health widgets at the top of the Data Quality page show the summary of issues detected by the monitors in the current workspace.

- Custom monitors
This widget shows the percentage of the datastreams that match the validation rules defined by the custom monitors.
You can also see the number of unresolved issues and the number of new unresolved issues since yesterday when relevant.
- Timeliness
This widget shows the percentage of the datastreams that fetch and load data before the expected due time out of the datastreams monitored by the universal timeliness monitor.
You can also see the number of unresolved issues and the number of new unresolved issues since yesterday when relevant.
- Duplication
This widget shows the percentage of the datastreams that contain unique data out of the datastreams monitored by the universal duplication monitor.
You can also see the number of unresolved issues and the number of new unresolved issues since yesterday when relevant.
- Volume
This widget shows the percentage of the datastreams that fetch consistent volume of data out of the datastreams monitored by the universal volume monitor.
You can also see the number of unresolved issues and the number of new unresolved issues since yesterday when relevant.
- Column consistency
This widget shows the percentage of the datastreams that use consistent structure of the data extracts monitored by the universal column consistency monitor.
You can also see the number of unresolved issues and the number of new unresolved issues since yesterday when relevant.
Checking details of the Data Quality issues#
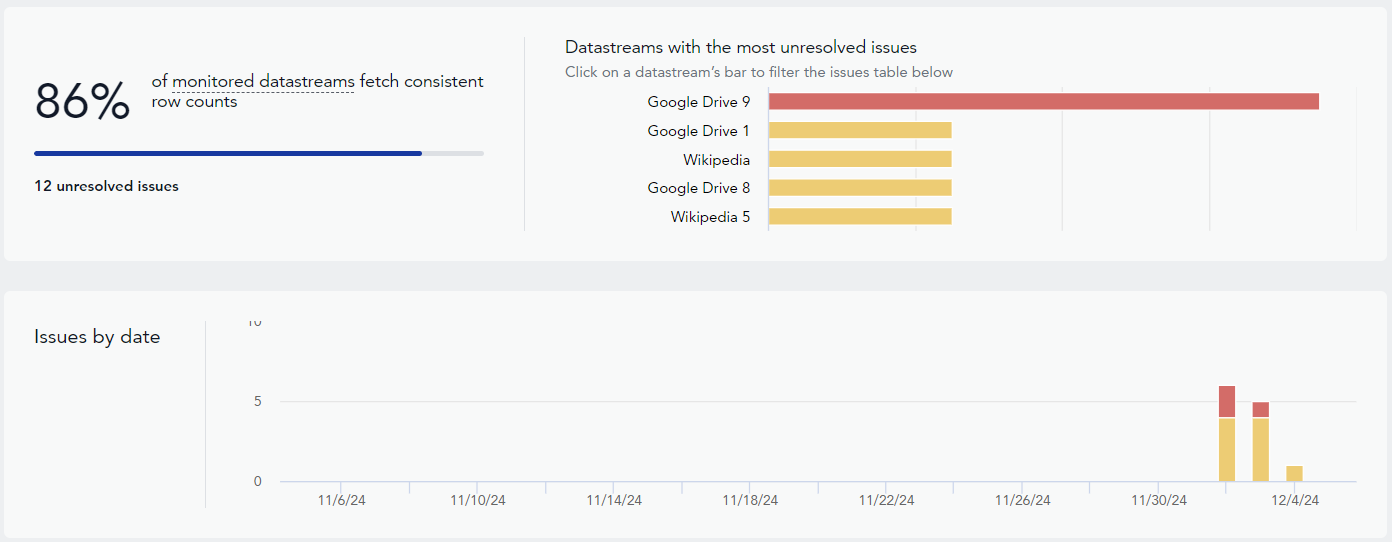
To see the details of the Data Quality issues shown in the health widgets, click on the widget of the selected monitor. The following summary is shown:

You can also see the issue details for each monitor type.
Duplication monitor

Volume monitor

Timeliness monitor

Column consistency monitor

Custom monitors

- Datastreams with the most unresolved issues
List of datastreams with their number of unresolved issues in the descending order.
Click on a bar representing a datastream to filter the issues for this datastream. Only issues from selected datastreams will appear on this page. You can edit the filters in the table of issues below.
- Issues by date
A bar chart for the last month showing when the Data Quality issues have occurred and their type.
Click on a bar to filter issues by the selected date. Only issues from this date will appear on this page. You can edit the filters in the table of issues below.
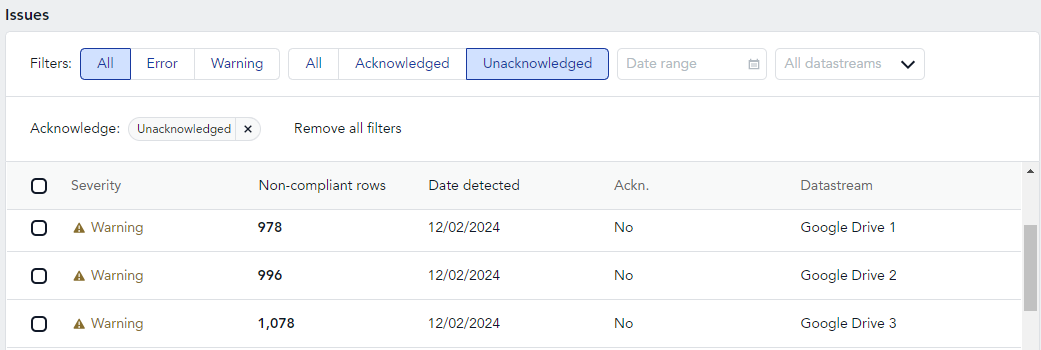
- Table of issues
The issues table shows the summary of Data Quality issues. You can use this table to:
Filter issues to find the relevant ones
See the details of an issue
Click on the issue’s row to open a pop-up with the issue details. For more information, see Viewing details of the Data Quality issues.
Acknowledge the selected issues
Universal monitors#

Universal monitors are pre-configured checks that monitor your data for common quality issues across all datastreams. The Data Quality page displays a card for each type of universal monitors:
Duplication - Checks for duplicate rows within your data extracts to ensure data integrity.
Volume - Monitors for significant deviations in the number of rows fetched, helping to identify incomplete or unexpectedly large datasets.
Timeliness - Verifies that your data is fetched and loaded by its expected due time, preventing delays in your reporting.
Column Consistency - Ensures that the column structure of your data extracts remains consistent over time, flagging any unexpected changes.
Click on a universal monitor’s card to see a detailed breakdown of its issues, including the affected datastreams, their data sources, and the severity of each issue.
For more information about universal monitors, see Working with universal monitors.
For more information on managing universal monitors in bulk, see Managing universal monitors in bulk.
Custom monitors#

Note
To create a new custom monitor, click + Create custom monitor in the top-right corner of the Data Quality page. For more information, see Creating a custom monitor.
From the overview, you can:
Filter your custom monitors by severity (all, error, or warning) or by workspace using the dropdown menu.
Search for a custom monitor by Name.
Manage your monitors using the Select an action menu next to the monitor. The options available here depend on your role and permissions. For more information, see Managing user permissions.
The second table in the middle of the Data Quality page contains important information about your monitors in the following columns:
Name - the name of this custom monitor
Assigned to - the number of datastreams to which this custom monitor is assigned
Workspace - the workspace in which this custom monitor was created
Severity - the severity of the issues triggered by the custom monitor
The filters above the table allow you to view specific monitors in the table. You can apply more than one filter at the same time to view specific monitors:
Severity - displays all custom monitors raising an issue of the selected severity type
Workspace - displays all custom monitors that were created in the selected workspace
You can also use the search bar to search for monitors by the Name column in the table. You can use the search function with or without filters applied.
Click Select an action in a specific monitor’s row in
the table to perform additional actions with this monitor. The
actions you can perform are:
Delete monitor - allows you to delete this monitor
For more information about custom monitors, see Working with custom monitors.
Preparing marketing data for AI use#
If you are preparing your marketing data for analysis and AI use cases, see Preparing marketing data for AI use.